Style Sampler
Layout Style
Patterns for Boxed Mode


Backgrounds for Boxed Mode
Search News Posts
General Inquiries 1-888-555-5555
•
Support 1-888-555-5555

Brain Tumor Classification
In this study, three-class brain tumor consisting of lung and breast metastases classification was carried out primary type glioma and secondary type glioma were used using MR images.
The web application that is used as a real-time database on the cloud is the cloud-native database. The trained parameters of the model are stored in the database, and prediction is done in real-time.
Further, the user is also notified of the accuracy of the model. Apart from this, the news article from trusted sources is also shared in the app in real-time.
As in all disease prediction models, patient data will be preprocessed first. The second step will be the first step that defines the prediction model. Many parameters and hyperparameters must be set when defining the model. These elements have a very significant effect on accuracy, they can also prevent under-fitting and overfitting of our prediction model. The third step is to fit the data to the model and finally the fourth step will be to verify the model accuracy.
The e main aspects of the service is as follow
The first part is about preparing and preprocessing the data. This part discusses different features related to each other and also how some features are eliminated from the process.
The load data consists of 70,000 data points.Out of the features listed in the table, the features used include “age,” “gender,” “height,” “weight,” “cholesterol,” “gluc,” “smoke,” “alco,” “ap_hi,” and “ap_lo.”. There were some outliers. *e value of systolic blood pressure above 200 and the value of diastolic pressure above 150 are referred to as outliers here. A snapshot of the dataset is shown below.
The dataset can be seen as below. Dataset has demographic properies of the invidiual as wel as habits.
Heart disease dataset used in this study has features shown below.
Id
Age
Gender
Height
Weight
Ap_lo
Cholesterol
Gluc
Smoc
Alco
Active
Cardio
0
18393
2
168
62.0
110
80
1
1
0
1
0
1
20228
1
156
85.0
140
90
3
1
0
1
1
2
18857
1
165
64.0
130
70
3
1
0
0
1
3
17623
2
169
82.0
150
100
80
1
0
1
1
4
17474
2
158
58.0
100
60
80
1
0
0
0
For analysis of features, a heat map was drawn as below. According to the heat map, the most important features in determining heart disease include systolic and diastolic blood pressure, cholesterol, and age.
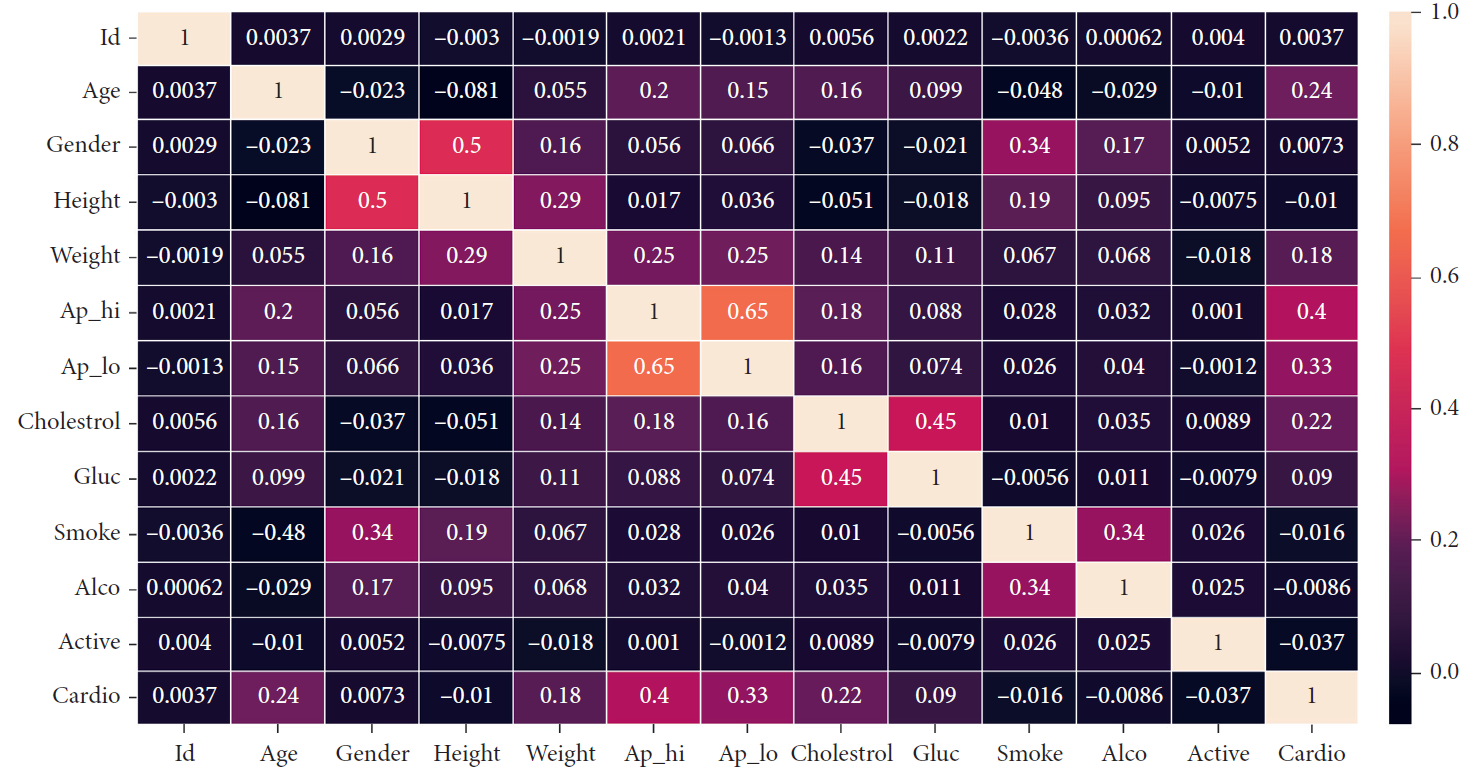
The most important features in determining heart disease shown in the table as below.
Feature
Description
Age
Days-integer
Height
Height in cm-integer
Weight
Weight in kg-float
Systolic blood pressure
Categorical code (1-women, 2-men)
Diastolic blood pressure
Integer
Cholesterol
1: normal, 2: above normal, 3: well above normal
Glucose
1: normal, 2: above normal, 3: well above normal
Alcohol intake
Binary
Physical activity
Binary
Presence or absence of cardiovascular disease
Binary
After cleaning and analyzing the dataset, machine learning models were applied. The logistic regression model is used for all the datasets. To make the prediction, the coefficients and intercept of all the three logistic regression models are stored in a cloud-native real-time database.
This case study provides insights into using the machine learning models to predict the risk of heart disease in an individual based on answering a few questions related to various factors like travel history, age, gender, and blood pressure. Logistic regression is used for prediction.
The findings in this diagnosis service can be helpful in the early screening of potential heart disease patients. It can be helpful in the sense that the first screening can be performed at the comfort of home. If a high risk of disease is predicted in a patient, then it can be followed by clinical trials for confirmation.
Anaplatform Data Consultancy is a premium consulting company tailored for businesses and corporations. anaplatform Data Consultancy is ideal for businesses of any type such as corporations, educational institutions, security firms and enterprise-level organizations.


