Style Sampler
Layout Style
Patterns for Boxed Mode


Backgrounds for Boxed Mode
Search News Posts
General Inquiries 1-888-555-5555
•
Support 1-888-555-5555

Finance and Risk Analytics
Portfolio return calculation will be made in the desired date range using the data in the table below. You can see the portfolio return account over the last 21 working days.
DATE
CAC
DAX
DJI
SP
FTSE
NIKKEI
NASDAQ
VIX
04.01.2010
4013,96
6048,29
10583,95
4013,96
6048,29
10583,95
4013,96
6048,29
05.01.2010
4013,96
6048,29
10583,95
4013,96
6048,29
10583,95
4013,96
6048,29
06.01.2010
4013,96
6048,29
10583,95
4013,96
6048,29
10583,95
4013,96
6048,29
07.01.2010
4013,96
6048,29
10583,95
4013,96
6048,29
10583,95
4013,96
6048,29
08.01.2010
4013,96
6048,29
10583,95
4013,96
6048,29
10583,95
4013,96
6048,29
...
...
...
...
...
...
...
...
...
08.01.2022
4013,96
6048,29
10583,95
4013,96
6048,29
10583,95
4013,96
6048,29
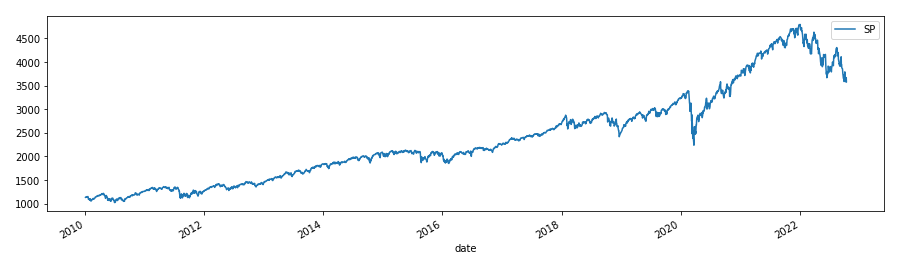
It shows the status of the S&P 500 stock index published by Standard & Poor's.
Click on Calculate Return button to see portfolio return results and maximum benefit.
SP
count 2943.000000
mean 2372.644913
std 977.094492
min 1022.580017
25% 1547.070007
50% 2109.409912
75% 2900.479980
max 4793.540039
Maximum Benefit : 1715.0
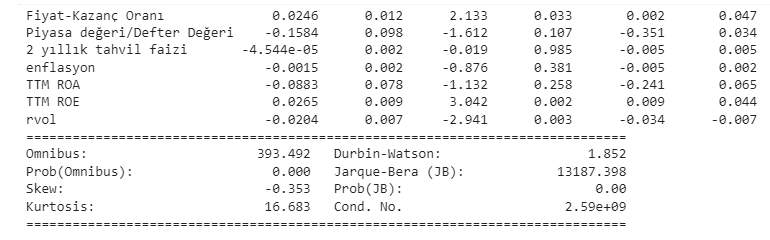
In this case study, Prediction modeling was done with Multivariate regression.
Click on the calculate button to see the portfolio return result!
Result:
As an example, downloading financial data from Yahoo Finance and investing.com via Python for company A is shown.
anaplatform Data Consultancy is a premium consulting company tailıred for businesses and corporations. anaplatform Data Consultancy is ideal for businesses of any type such as corporations, educational institutions, security firms and enterprise-level organizations.


