Style Sampler
Layout Style
Patterns for Boxed Mode


Backgrounds for Boxed Mode
Search News Posts
General Inquiries 1-888-555-5555
•
Support 1-888-555-5555

Fraud Detection
The insurance company was facing a significant issue of fraudulent claims, leading to increased costs and lower profits. The company's existing fraud detection system was not efficient, and many fraudulent claims went undetected. The company needed a more advanced system to detect fraud quickly and accurately.
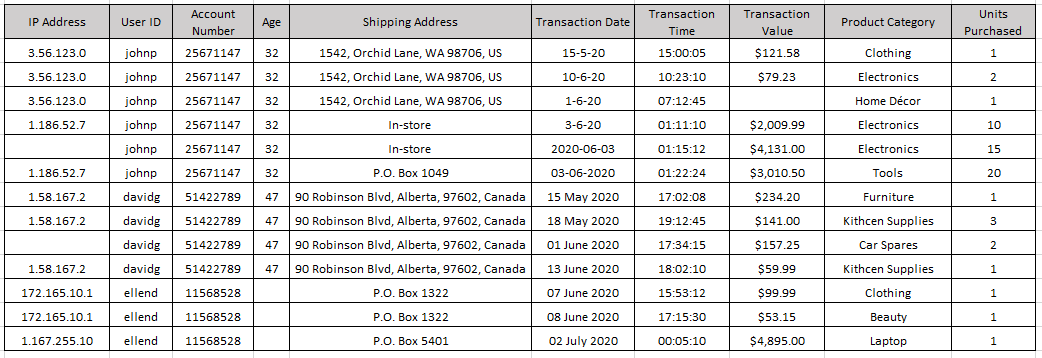
The dataset contains information about insurance claims filed by customers of an insurance company. The data includes information about the policy holder, the type of policy, the claim amount, and other relevant details.
Policy No
Policy Holder
Policy Type
Claim Date
Claim Amount
Claim Type
Claim Description
Claim Status
Claim Investigator
Fraudulent Status
12345
John S.
Auto
01/01/2022
$5,000
Accident
Car hit
Approved
Jane D.
0
12345
jane D.
Home
2/1/2022
$10,000
Theft
Jewelry
Pending
John S.
0
13579
Sara L.
Auto
01/01/2022
$2,000
Accident
Hit
Denied
Mary J.
0
24680
Tom B.
Auto
04/01/2022
$100,000
Medical
Surgery
Approved
Jane D.
0
98765
Kim B.
Auto
05/01/2022
$8,000
Accident
Car hit
Pending
Sara L.
0
12345
John S.
Auto
01/01/2022
Approved
$5,000
Car hit
Approved
Jane D.
0
12345
John S.
Auto
01/01/2022
Approved
$5,000
Car hit
Approved
Jane D.
0
We implemented a new fraud detection system for the insurance company that uses data analytics and machine learning. The system analyzed data from various sources, including claims data, policy data, and customer data, to identify patterns and anomalies that could indicate fraud. The system used advanced algorithms to detect fraudulent claims and flag them for further investigation.
The system worked by analyzing various data points in a claim and comparing them to the normal behavior of similar claims. If the system detected any inconsistencies or anomalies, it flagged the claim for further investigation. For example, if a claimant had a history of making frequent claims, but suddenly filed a high-value claim, the system would flag that claim for investigation.
The system was also trained to identify common fraud schemes, such as staged accidents, false injury claims, and fraudulent billing. By analyzing large amounts of data, the system could identify these schemes and flag any claims that matched the patterns.
The insurance company also used external data sources, such as social media, to investigate claims further. For example, if a claimant reported an injury but posted photos on social media showing them engaging in physical activity, the system would flag the claim for investigation.
The new fraud detection system was highly successful in detecting fraudulent claims. In the first year of implementation, the system detected over 500 fraudulent claims, resulting in savings of over $5 million for the insurance company. The system also improved the efficiency of the fraud detection process, allowing the company to investigate and resolve fraudulent claims quickly.
Fraud detection is a crucial issue for the insurance industry, and advanced data analytics and machine learning techniques can help insurers detect fraudulent claims quickly and accurately. By implementing a robust fraud detection system, insurers can save money, protect their customers, and maintain their profitability.
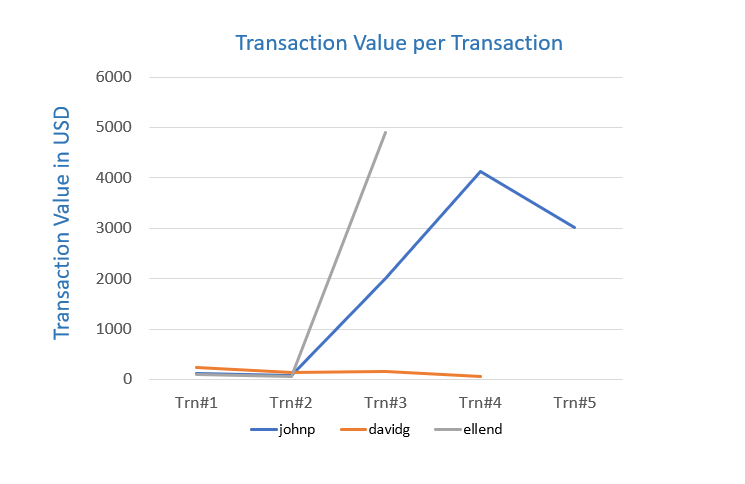
Descriptive techniques of analysis, that is, techniques that help you gain an understanding of what happened, including the identification of patterns and anomalies in data. Anomalies signify a variation in a pattern that seems uncharacteristic, or, out of the ordinary. Anomalies may occur for perfectly valid and genuine reasons, but they do warrant an evaluation because they can be a sign of fraudulent activity.
The essential decision we need to make is how many units or Product X to produce each week. That's our decision variable which we denote as x. The weekly revenues are then $270x. The costs include the value of the raw materials and each form of labor. If we produce x units a week, then the total cost is $40x. which means there is a profit earned on each unit of X produced, so let's produce as many as possible.
There are three constraints that limit how many units can be produced. There is market demand for no more than 40 units per week. Producing x = 40 units per week will require 40 hours per week of Labor A, and 80 hours per week of Labor B. Checking those constraints we see that we have enough labor of each type, so the maximum profit will be $1600 per week. What we conclude is that market demand is the 'most constraining constraint.' Once we've made that deduction, the rest is a straightforward problem that can be solved by inspection.
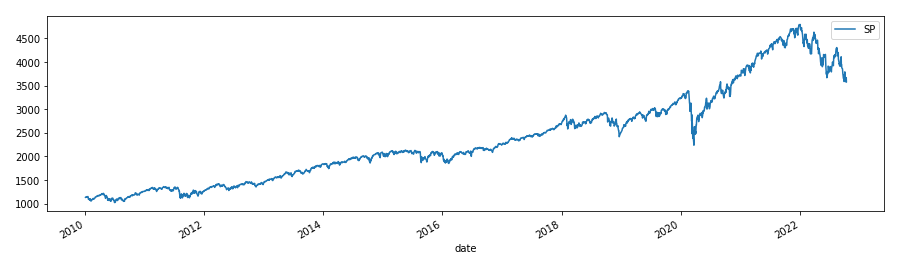
The graph below samples one such visualization that you would use to capture a trend hidden in the sample data set shared earlier on in the case study.
It shows the status of the S&P 500 stock index published by Standard & Poor's.
Click on Calculate Return button to see portfolio return results and maximum benefit.
SP
count 2943.000000
mean 2372.644913
std 977.094492
min 1022.580017
25% 1547.070007
50% 2109.409912
75% 2900.479980
max 4793.540039
Maximum Benefit : 1715.0
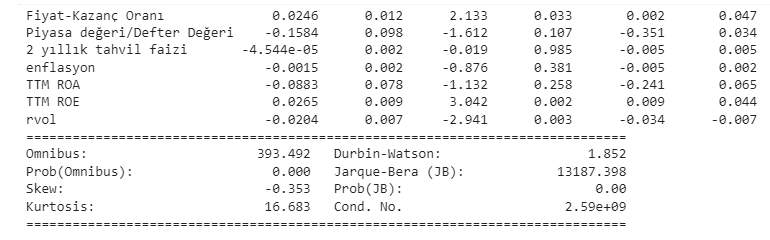
In this case study, Prediction modeling was done with Multivariate regression.
Click on the calculate button to see the portfolio return result!
Result:
As an example, downloading financial data from Yahoo Finance and investing.com via Python for company A is shown.
anaplatform Data Consultancy is a premium consulting company tailıred for businesses and corporations. anaplatform Data Consultancy is ideal for businesses of any type such as corporations, educational institutions, security firms and enterprise-level organizations.


