Style Sampler
Layout Style
Patterns for Boxed Mode


Backgrounds for Boxed Mode
Search News Posts
General Inquiries 1-888-555-5555
•
Support 1-888-555-5555

Long Term Load Forecasting
The purpose of this case study is to demonstrate one method of how effortlessly you can automate the data extraction, transformation, and building of an accurate ST-ELF forecasting pipeline with anaplatform services such as Load Forecast. anaplatform Load Forecast is a fully managed service that uses advanced machine learning techniques to deliver highly accurate forecasts. This methodology paves the way for utilities to generate accurate ST-ELF models without incurring significant investment in AI/ML and data scientists.
This solution is fully automated and was tested and verified on multiple actual feeders. Forecast performance measured in MAPE with the average of 5-7% among randomly tested feeders.
In this case study, we will analyze next 5 years of energy consumption for Gebze, an industrial city in the Marmara region of Turkey. Electricity plays a pivotal role on every activity in Gebze. It is the basic source of energy to the industries and currently the only clean source of power for domestic use by the people of Bonny kingdom. For effective use of this scare resources, proper forecasting is necessary. The importance of accurate forecasting ensures the availability of electricity supply and best use of generated capacit.
As in all prediction models, data will be preprocessed first. The second step will be the first step that defines the model. Many parameters and hyperparameters must be set when defining the model. These elements have a very significant effect on accuracy, they can also prevent under-fitting and overfitting of the model. The third step is to fit the data to the model and finally The fourth step will be to verify the model accuracy.
The short-term load forecast (LTLF) represents the electric load forecast for a time interval of a few hours to a few days. This thesis will define STLF as a 24-hour-ahead load forecast whose results will provide an hourly electric load forecast in kilowatts (kW) for the future 24 hours (a 24-hour load profile).
Because of weather variables, having different load curves for each season is a possibility. Power systems minimize the operation cost by using weather forecasting models in load forecasting.
Gebze is a fast growing industrial hub in Marmara region of Turkey. It is situated approximately 40 km south-east of Port Tuzla in Istanbul City, Turkey.
Gebze area has undergone tremendous physical and economic growth in the last two decade as a result of continued industrial development and movement of human skill sets
This growth is expected to continue in the future due to many strategic advantages that Gebzer- possess. Notably among these advantages are its ready access to deep water, a host community to many oil and gas networks and its prospect for the location for petrochemical and port facilities.
Power supply to the Gebze community is mostly provided by Yeni Elektrik Doğalgaz Çevrim Santrali with supply capacity of 865MW and Tüpraş with supply capacity of 253MW Apart from these One Natural Gas and 2 thermal power plant plants with a combined supply capacity of 566MW and is managed by Çolakoğlu Metalurji Company.
Plant Name
Company
Power
Yeni Elektrik Doğalgaz Çevrim Santrali
Unit Elektrik
965 MW
TÜPRAŞ Kocaeli Santrali
TÜPRAŞ
253 MW
Çolakoğlu 2 Termik Santrali
Çolakoğlu Metalurji
190 MW
Çolakoğlu 2 Termik Santrali
Çolakoğlu Metalurji
123 MW
Entek Köseköy Doğalgaz Santrali
Koç Holding
112 MW
The data contains thousands of weather data per minute broken down by minute, product type, cost, purchase address, etc.
The first part is about preparing and preprocessing the data. This part discusses different features related to each other and also how some features are eliminated from the process.
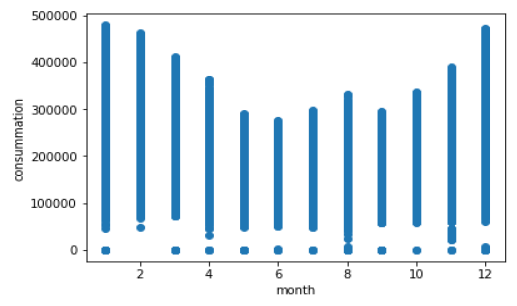
The load data consists of last 5 years of energy consumptin of data of Turkey Disctricy, Gebze.
The dataset can be seen as below. Dataset has three main features, minimum, average, and maximum load Consumption. This information was gathered for 15 minutes intervals from 1/10/2013 to 20/9/2019. Each day has 96 samples in the dataset. Below figure is a part of this information, which depicts the first 27 samples from the dataset.
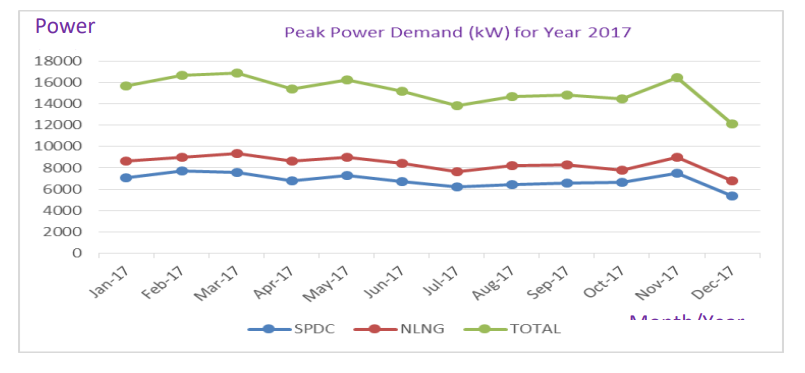
The data presented on figures 3.1 to 3.3 show a seasonal pattern on the power demand for the period 2017 - 2019. The power demand is fairly steady at an average of 17MW from November to May with a dip in power demand from June to September to about 15MW. It start to rise steadily again by October.
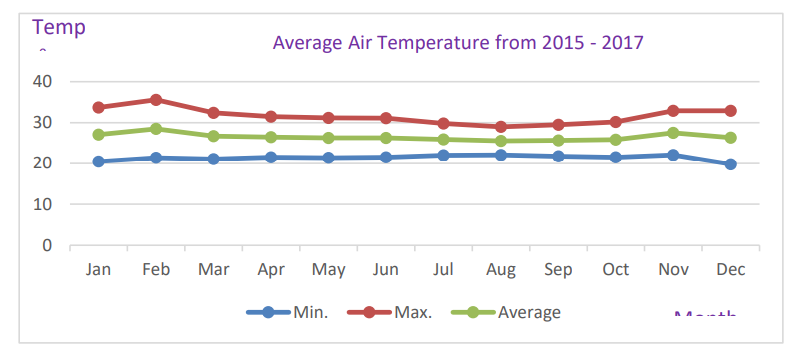
This trend is likely caused by the dry and wet seasons of Gebze as noticed on the temperature profile shown on figures 3.4 to 3.6. Though relatively constant, the temperature of Gebze changes based on the season. Highest temperature of about 330C observed during the end of dry season (February - March) and minimum of 210C during the peak of raining season (July - August).
The figures below indicate the average air temperature of Gebze for a period from 2015 - 2019
The most significant independent variable is the weather. Weather conditions influence domestic and agriculture subscribers more than industrial ones. Because of weather variables, having different load curves for each season is a possibility.
The weather factors are listed below:
The total consumption in summer and winter is much higher than in spring and fall. Most of the people use air conditioners in these two seasons.
Humans behaviour is unpredictable that no science is able to anticipate whole human behaviour and it even twists more when the case is related to a population. Every engineering project has its undesired issues.
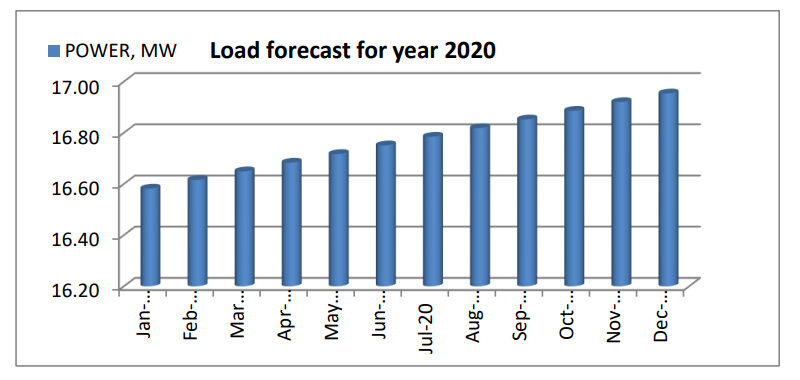
From figures below, it is expected that there will be steady load growth for Gebzed from 16.6MW to over 21MW in next 10-years. By the end of 2027, the combined installed capacity by Elektrik Doğalgaz Çevrim Santrali and Thermal Power Plants would hit its limit of 1500MW
Inputing the values for the forecasted months and years gives the predicated power demand for next 10-years as shown below.
Results of the models used, reveal an increase in load consumption during the dry season and a reduction in load during the raining seasons. This means that power demand and supply can be at the minimum during this period, and major maintenance, upgrade operation on the power generation and distribution system can take place during this period.
Taking into account the various factors affecting load demand and forecasting, Gebze may exceed it 20MW capacity currently supply by Elektrik Doğalgaz Çevrim Santrali and Thermal Power Plants earlier than 2027. As such both companies should review it power supply strategy to the Gebze communities and plan the upgrade of its power distribution network at the earliest possible time.
The third case uses all of the variables to gather. The accuracy of the model is calculated in each case and compared with others to find the best solution.
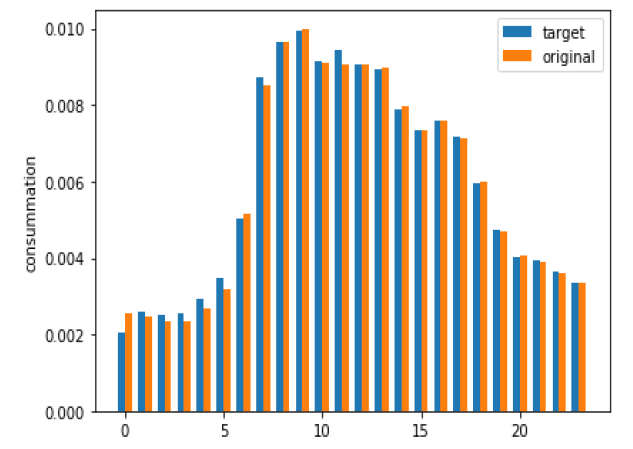
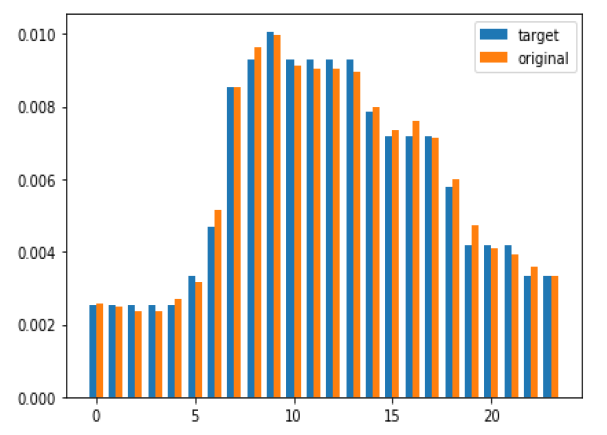
The results of forecasting for 24 hours are in table below. This figure also has the original values and error amount in percent.
All data are gathered together and normalized as below.
All data are gathered together and normalized as below.
In the table below RSG values shows the accuracy of four different methods and MSE shwos forecasting errors for different methods
Method
MAE
MSE
RSG
Decision Tree
0.000224
7.64e-08
0.97476
KNN
0.000418
2.55e-07
0.91549
Linear Regression
0.0000655
8.19e-09
0.977295
ANN
0.0003469
1.95e-07
0.985306
Anaplatform Data Consultancy is a premium consulting company tailored for businesses and corporations. anaplatform Data Consultancy is ideal for businesses of any type such as corporations, educational institutions, security firms and enterprise-level organizations.


