Style Sampler
Layout Style
Patterns for Boxed Mode


Backgrounds for Boxed Mode
Search News Posts
General Inquiries 1-888-555-5555
•
Support 1-888-555-5555

Finance and Risk Analytics
This case requires to develop a customer segmentation to give recommendations like saving plans, loans, wealth management, etc. on target customer groups.
The sample Dataset summarizes the usage behavior of about 9000 active credit card holders during the last 6 months. The file is at a customer level with 18 behavioral variables.
Following is the Data Dictionary for customer's credit card dataset :-
CUSTID : Identification of Credit Card holder (Categorical)
BALANCE : Balance amount left in their account to make purchases
BALANCEFREQUENCY : How frequently the Balance is updated, score between 0 and 1 (1 = frequently updated, 0 = not frequently updated)
PURCHASES : Amount of purchases made from account
ONEOFFPURCHASES : Maximum purchase amount done in one-go
INSTALLMENTSPURCHASES : Amount of purchase done in installment
CASHADVANCE : Cash in advance given by the user
PURCHASESFREQUENCY : How frequently the Purchases are being made, score between 0 and 1 (1 = frequently purchased, 0 = not frequently purchased)
ONEOFFPURCHASESFREQUENCY : How frequently Purchases are happening in one-go (1 = frequently purchased, 0 = not frequently purchased)
PURCHASESINSTALLMENTSFREQUENCY : How frequently purchases in installments are being done (1 = frequently done, 0 = not frequently done)
CASHADVANCEFREQUENCY : How frequently the cash in advance being paid
CASHADVANCETRX : Number of Transactions made with "Cash in Advanced"
PURCHASESTRX : Numbe of purchase transactions made
CREDITLIMIT : Limit of Credit Card for user
PAYMENTS : Amount of Payment done by user
MINIMUM_PAYMENTS : Minimum amount of payments made by user
PRCFULLPAYMENT : Percent of full payment paid by user
TENURE : Tenure of credit card service for user
DATE
CAC
DAX
DJI
SP
FTSE
NIKKEI
NASDAQ
VIX
04.01.2010
4013,96
6048,29
10583,95
4013,96
6048,29
10583,95
4013,96
6048,29
05.01.2010
4013,96
6048,29
10583,95
4013,96
6048,29
10583,95
4013,96
6048,29
06.01.2010
4013,96
6048,29
10583,95
4013,96
6048,29
10583,95
4013,96
6048,29
07.01.2010
4013,96
6048,29
10583,95
4013,96
6048,29
10583,95
4013,96
6048,29
08.01.2010
4013,96
6048,29
10583,95
4013,96
6048,29
10583,95
4013,96
6048,29
...
...
...
...
...
...
...
...
...
08.01.2022
4013,96
6048,29
10583,95
4013,96
6048,29
10583,95
4013,96
6048,29
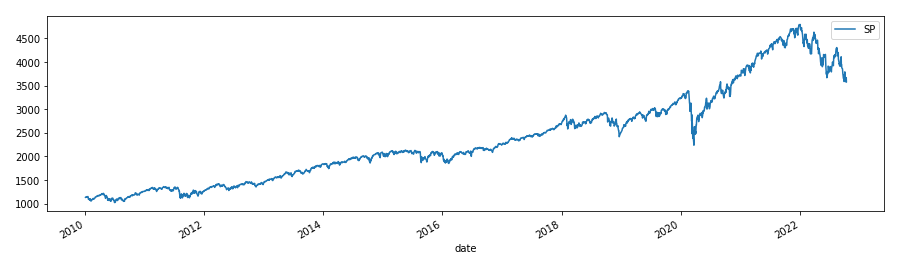
It shows the status of the S&P 500 stock index published by Standard & Poor's.
Click on Calculate Return button to see portfolio return results and maximum benefit.
SP
count 2943.000000
mean 2372.644913
std 977.094492
min 1022.580017
25% 1547.070007
50% 2109.409912
75% 2900.479980
max 4793.540039
Maximum Benefit : 1715.0
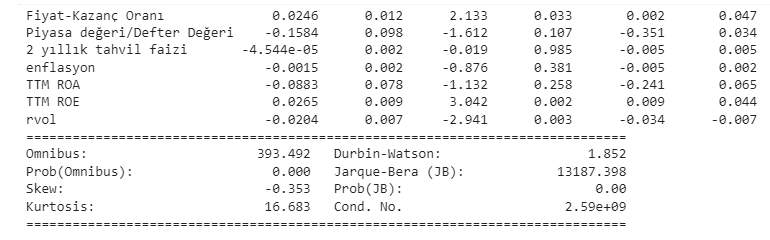
In this case study, Prediction modeling was done with Multivariate regression.
Click on the calculate button to see the portfolio return result!
Result:
As an example, downloading financial data from Yahoo Finance and investing.com via Python for company A is shown.
anaplatform Veri Danışmanlığı, işletmeler ve şirketler için özel olarak hazırlanmış birinci sınıf bir danışmanlık şirketidir. anaplatform Veri Danışmanlığı, şirketler, eğitim kurumları, güvenlik firmaları ve kurumsal düzeydeki kuruluşlar gibi her türden işletme için idealdir..


