Style Sampler
Layout Style
Patterns for Boxed Mode


Backgrounds for Boxed Mode
Search News Posts
General Inquiries 1-888-555-5555
•
Support 1-888-555-5555

Marketing Mix Analysis
Media Mix Modeling is an analysis technique to understand and quantify the impact that advertising has on its desired goal, typically sales of the product being promoted.
This case study will walk through the principles of Media Mix Modeling and demonstrate various modeling techniques with a very simple approach and progressively leveling up model complexity.

Your company has advertised across three channels in the past few years; TV, radio, and online. You have a new product releasing at the end of the year and you want to know what advertising channels have worked in the past so you can create the optimal media mix for the product launch campaign.
First we will use simplest technique for uncovering the hidden connections between advertising spending and sales. We will begin with a sample data as below.
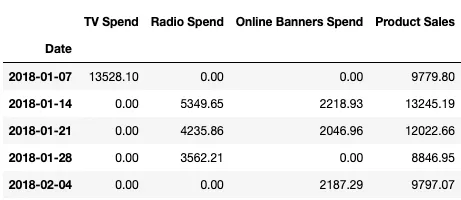
In the data set we see historical investment in three advertising channels by week over the course of 200 weeks. These will be our features in the linear regression model.
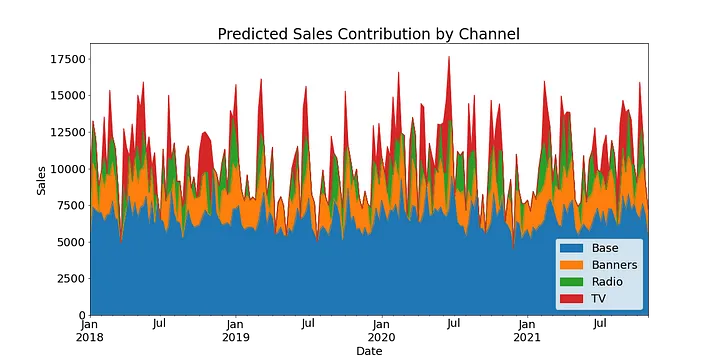
Media Mix Modeling uses the historical data from the advertiser to draw connections between spend (X) and sales (y). These connections not only help illuminate the ROI of past investments, they unlock the ability to optimize future media plans.
Let’s create a regression plot that shows the relationship between loudness and energy. I’ll plot this regression line below.
The result is plotted. As the volume gets louder, the energy values go up. The data points provided are all in one direction, which means that as the volume goes up, so does the energy level. The volume of the song increases in correlation with the pitch, so that if a song is louder, it simultaneously sounds fast. Similarly, if a song’s pitch is higher, its volume also increases correspondingly; if the pitch decreases and gets lower-pitched, then its volume also lowers to match this.
Now we will show a bar plot which shows duration. The duration of songs varies quite a lot by genre.
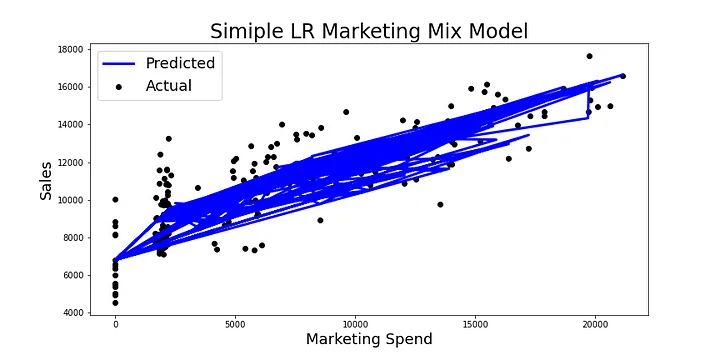
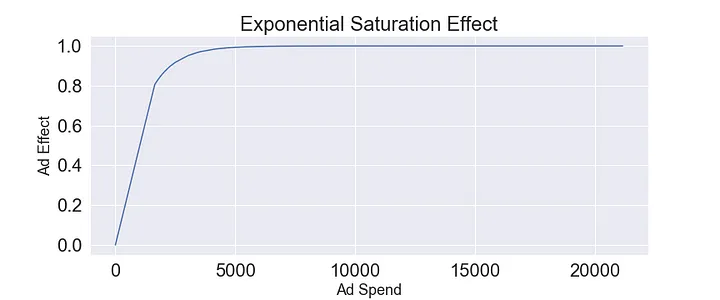
This model assumes a linear relationship between ad spend and sales which any advertiser can tell you is not true. Advertising becomes marginally less effective the more you spend because the market has been saturated, it has partially absorbed the message already.
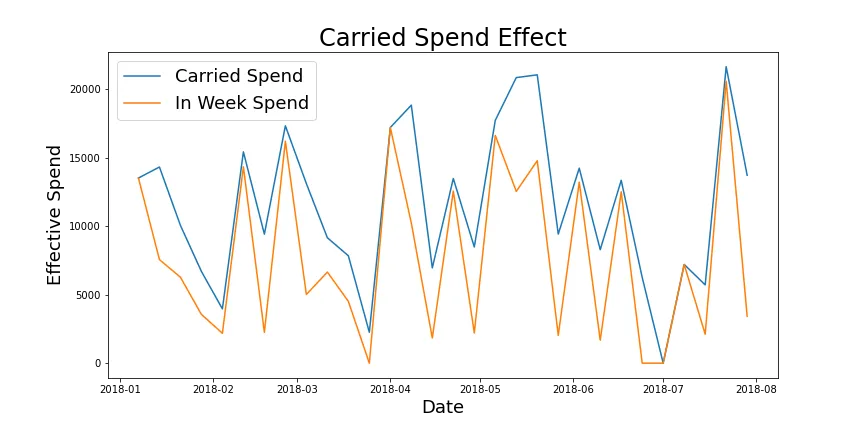
Our simple model assumes that the entire effect advertising has on sales is absorbed in the same week the spending takes place. Marketers understand that in reality there is a halo effect where advertising in period 1 impacts sales in future periods as well. The carry-over effect has two variables which can be visualized as a vertical and horizontal shift respectively.
Strength (how much spend from previous periods carries over to future periods) is the vertical shift of effective spend. You can see in the graph below that the carried spend is an upward shift of the in-week spend.
Length (how many periods into the future does ad spend today impact) is the horizontal shift of effective spend. You can see in the graph below that the carried spend is a rightward shift of the in-week spend.
The result is that the ARPU is $ 27.32 and the Net Revenue per user is $25.32.
Here are the Findings
Anaplatform Data Consultancy is a premium consulting company tailored for businesses and corporations. anaplatform Data Consultancy is ideal for businesses of any type such as corporations, educational institutions, security firms and enterprise-level organizations.


