Style Sampler
Layout Style
Search News Posts
General Inquiries 1-888-555-5555
•
Support 1-888-555-5555
Netflix Analysis
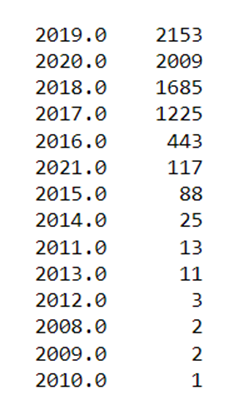
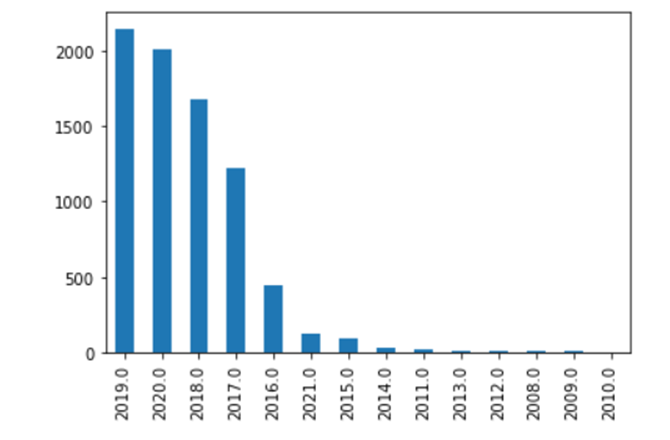
In this case study we will be using analysis with Netflix data. We want to see in which year highest number of TV Shows and Movies were released?
We will be using analytics to know which year highest TV Shows and Movies were released.


Now we will Show with bar graph.

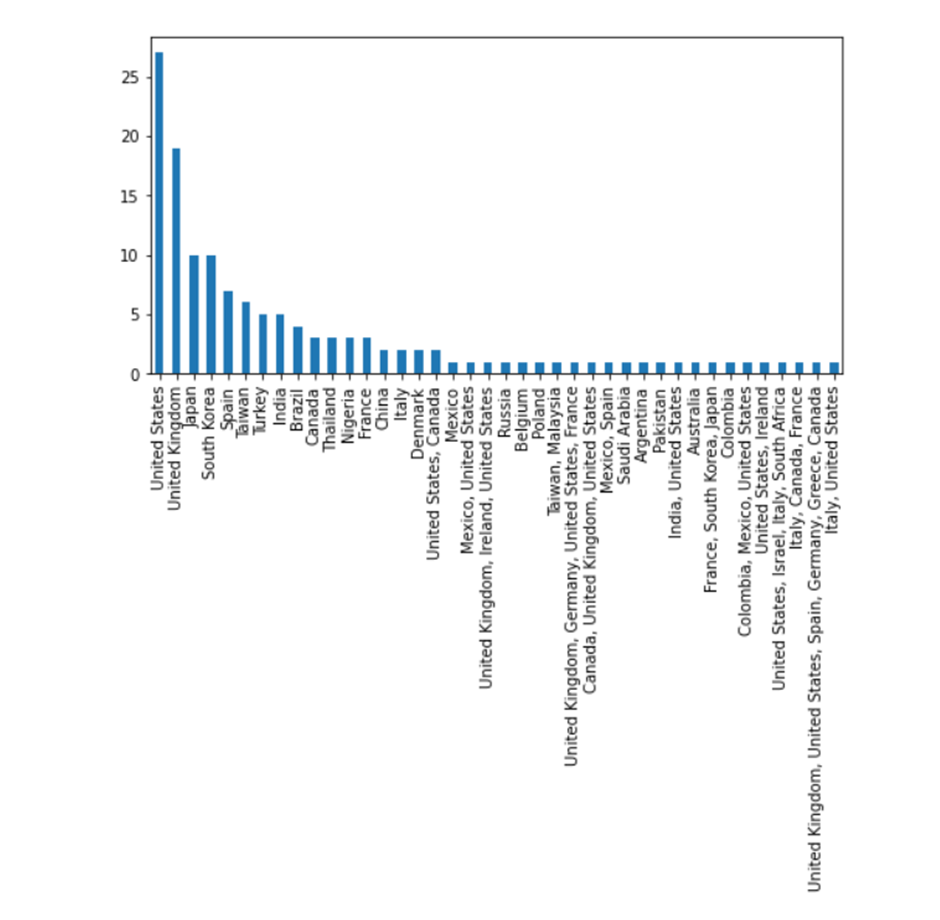
Now we will show which country has the highest no. of TV Shows with the bar graph.

The result is that the ARPU is $ 27.32 and the Net Revenue per user is $25.32.
Are you looking to create a lasting impact with your data analytics? Contact us to create them in hours.