Style Sampler
Layout Style
Patterns for Boxed Mode


Backgrounds for Boxed Mode
Search News Posts
General Inquiries 1-888-555-5555
•
Support 1-888-555-5555

Sales Analysis
In this case study, we will analyze sales data and answer business questions about 12 months worth of sales data. The data contains hundreds of thousands of electronics store purchases broken down by month, product type, cost, purchase address, etc.
The dataset can be seen as below. Typicaly these datas are stored per csv files per month on a cloud drive. First we need to make this data logical, our first task will be to merge all 12 months’ worth of sales data into a single file
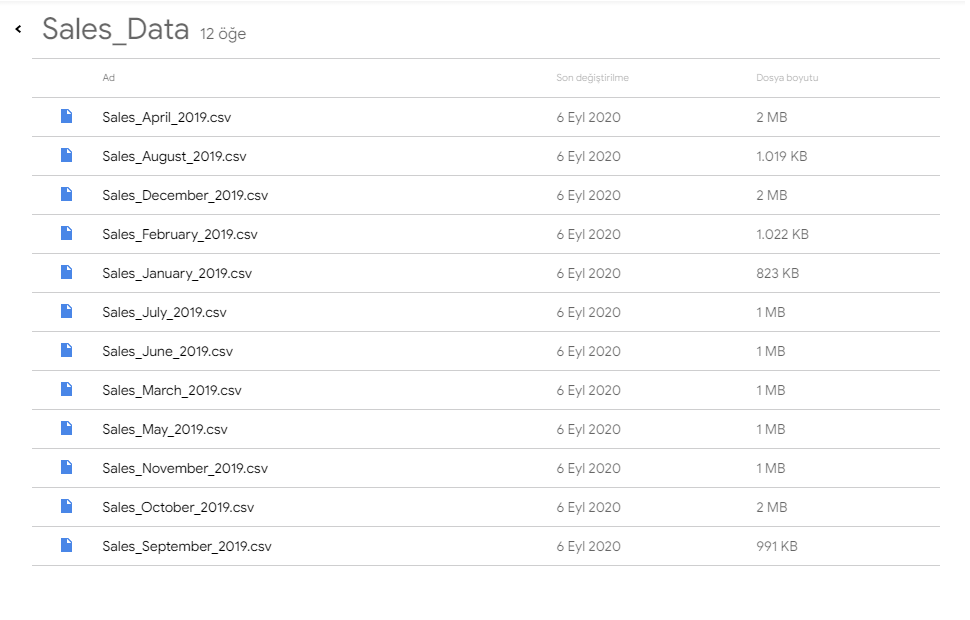
Now as the first task is to merge all 12 months’ worth of sales data into a single file. It will take a little time because of heavy computation. But once it’s done, we will see the data contains all 12 months data in our directory.
ID
Product
Quantity
Price
Order Date
Purchase Address
176558
USB Charging Cable
2
11.95
04/19/19 04:46
917 1st, Dallas, RX 75001
NaN
NaN
NaN
NaN
NaN
NaN
176559
SoundSport Headpohones
1
99.99
04/19/19 04:46
682 Chestnut St, Boston, MA 02215
176560
Google Phone
1
600
04/12/19 14:38
669 Spruce St, Loas Angeles, CA 90001
176560
Wired Headpohones
1
11.99
04/12/19 14:38
669 Spruce St, Loas Angeles, CA 90001
Throughout the task we will answer various questions, each will help us proper marketing.
We can answer these questions it by we using some analytics method.
Month
Ordered
Price
Sales
January
22703
22703
29287
February
30701
30701
22703
March
41563
41563
22703
April
17005
17005
22703
May
20558
20558
22703
June
18667
18667
24361
July
41563
41563
22703
August
17005
17005
22703
September
20558
20558
22703
October
18667
18667
24361
We use panda to read the csv file and create a dataframe from it. Now the first task is to merge all 12 months’ worth of sales data (12 csv files) into a single csv file. It will take a little longer time because of heavy computation. But once it’s done. You will see a new csv file contains all 12 months data in our directory.
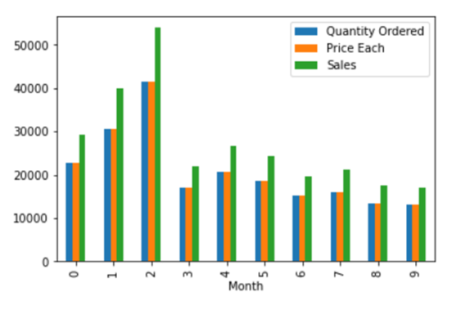
Now we see bar graph as below.
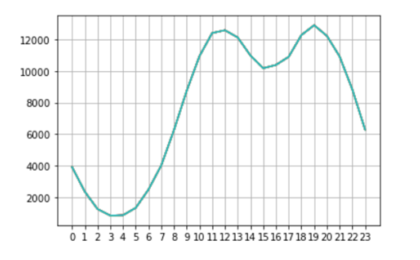
Now we can answer the third question, what time should we display advertisements to maximize likelihood of customer’s buying product? To answer this, we’re gonna group it by the hours and counting all of the orders.
Now we see bar graph as below.
Here are the Recommendations
Anaplatform Data Consultancy is a premium consulting company tailored for businesses and corporations. anaplatform Data Consultancy is ideal for businesses of any type such as corporations, educational institutions, security firms and enterprise-level organizations.


