Style Sampler
Layout Style
Patterns for Boxed Mode


Backgrounds for Boxed Mode
Search News Posts
General Inquiries 1-888-555-5555
•
Support 1-888-555-5555

Sensitivity Analysis
Lets say you are in charge of sales for your company, a business that sells Christmas decorations at a shopping mall. John knows that the holiday season is approaching and that the mall will be crowded. He wants to find out whether an increase in customer traffic at the mall will raise the total sales revenue of HOLIDAY CO and, if so, then by how much.
The average price of a packet of Christmas decorations is $20. During the previous year’s holiday season, your company sold 500 packs of Christmas decorations, resulting in total sales of $10,000.
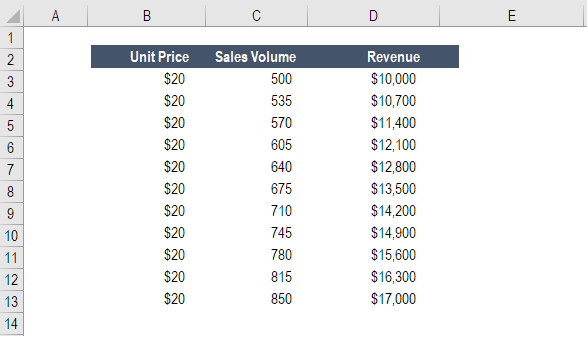
Here are the results after Sensitivity Analysis
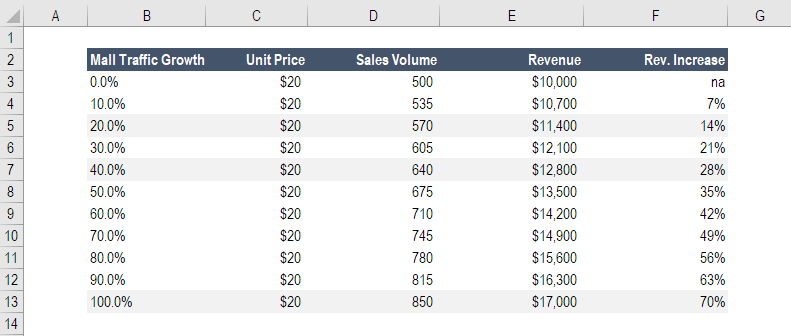
After carrying out a Financial Sensitivity Analysis, we determined that a 10% increase in customer traffic at the mall results in a 7% increase in the number of sales.
Using this information, we can predict how much money your company will generate if customer traffic increases by 20%, 40%, or 100%. Based on John’s Financial Sensitivity Analysis, such increases in traffic will result in an increase in revenue of 14%, 28%, and 70%, respectively.
Whether you are a small business owner or a large enterprise, our data analytics solutions can help you stay ahead of the curve and make informed decisions that drive business growth and success. Contact us today to learn more about how our services can benefit your organization!
Anaplatform Data Consultancy is a premium consulting company tailored for businesses and corporations. anaplatform Data Consultancy is ideal for businesses of any type such as corporations, educational institutions, security firms and enterprise-level organizations.


