Style Sampler
Layout Style
Patterns for Boxed Mode


Backgrounds for Boxed Mode
Search News Posts
General Inquiries 1-888-555-5555
•
Support 1-888-555-5555

Short Term Load Forecasting
In this case study we will analyze 5 years of energy consumption and weather data to answer enery consumption questions for Gebze. The data we will use contains thousands of weather data per minute broken down by minute, product type, cost, purchase address, etc.
Electric short term load forecasting is principal to the economic and efficient provision of electric power to meet various load demands for a specified period of time. The case study of this paper is on the short-term load forecast of for Gebze, an industrial city in the Marmara region of Turkey.
This study assumes that we have two datasets: one containing historical energy usage data and another containing weather forecast data. The code first preprocesses the data by extracting relevant features and merging the datasets. It then splits the data into training and testing sets and fits a linear regression model to the training data. Finally, it makes energy usage predictions for the testing data and prints out the predicted energy usage for the next hour.
Note that this is just a simple example and there are many other factors that can be taken into account for energy prediction, such as holidays, special events, and other external factors.
As in all prediction models, data will be preprocessed first. The second step will be the first step that defines the model. Many parameters and hyperparameters must be set when defining the model. These elements have a very significant effect on accuracy, they can also prevent under-fitting and overfitting of the model. The third step is to fit the data to the model and finally The fourth step will be to verify the model accuracy.
The short-term load forecast (STLF) represents the electric load forecast for a time interval of a few hours to a few days. This thesis will define STLF as a 24-hour-ahead load forecast whose results will provide an hourly electric load forecast in kilowatts (kW) for the future 24 hours (a 24-hour load profile).
Because of weather variables, having different load curves for each season is a possibility. Power systems minimize the operation cost by using weather forecasting models in load forecasting.
The first part is about preparing and preprocessing the data. This part discusses different features related to each other and also how some features are eliminated from the process.
The load data consists of last 5 years of energy consumptin of data of Turkey Disctricy, Gebze.
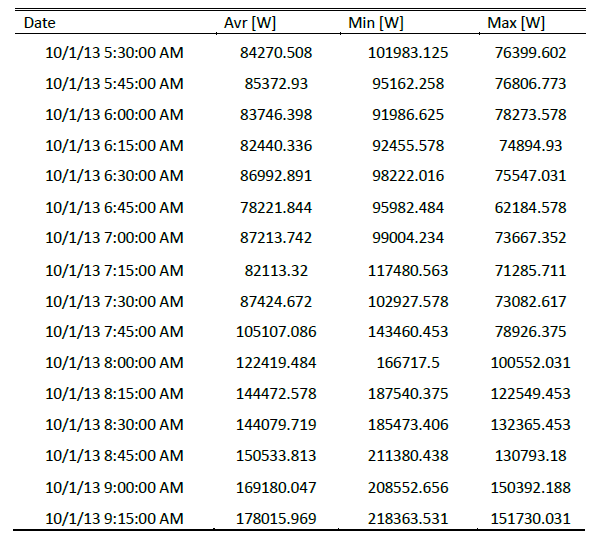
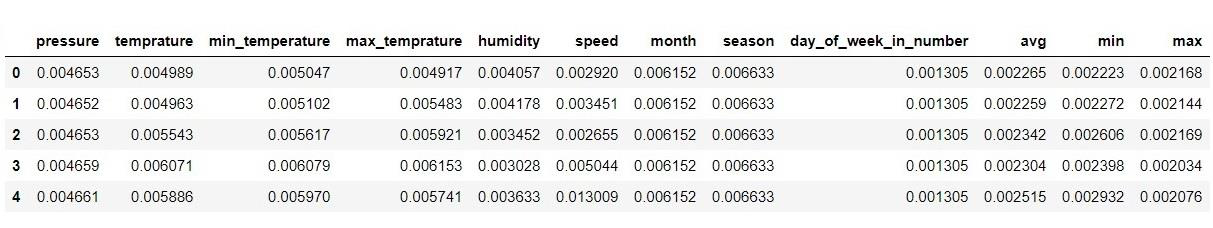
The dataset can be seen as below. Dataset has three main features, minimum, average, and maximum load Consumption. This information was gathered for 15 minutes intervals from 1/10/2013 to 20/9/2019. Each day has 96 samples in the dataset. Below figure is a part of this information, which depicts the first 27 samples from the dataset.
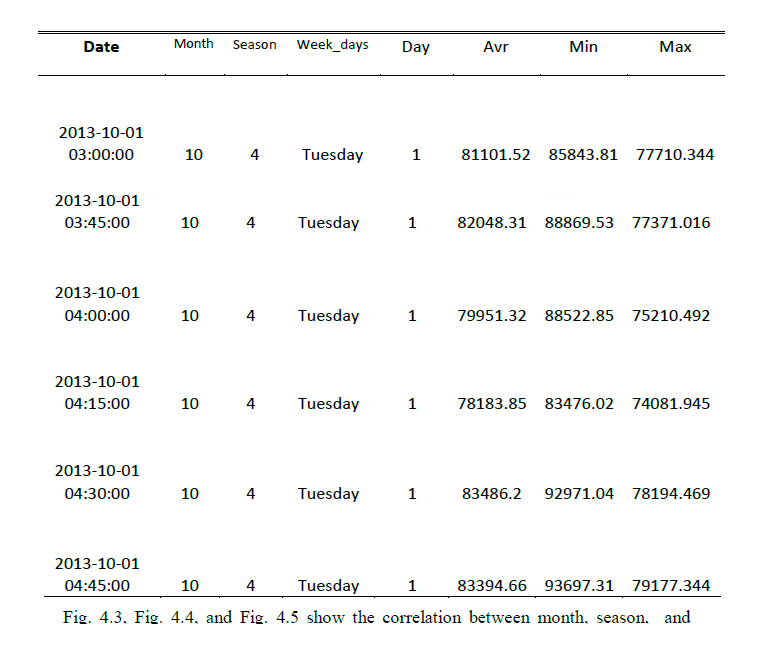
New features were added to the charts to find these relations.
These new features are season, month, and days of the week. By using these new features plotting and analyzing covariance between calendar variables has become quite simple. Weekdays shows the name of each day.
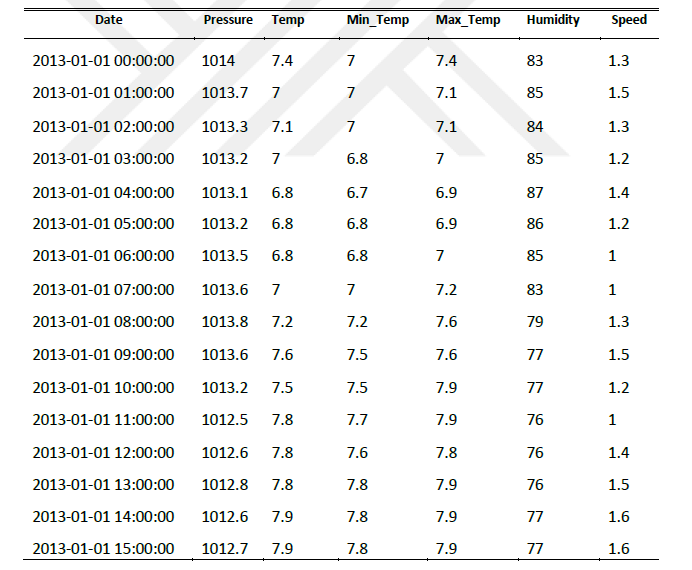
"The Meteorology Genel Müdürlüğü" maintains the weather data, which comes from two different stations and were gathered in the monthly format, so it was transformed into a suitable format in the first place. The weather data consists of humidity, temperature, maximum temperature, minimum temperature, pressure, and wind speed.
The hourly load information collected from 5 different soources and used as the sample data for the forecast.
The data also has other features that are not useable for this thesis. Some of them are not related directly to load Consumption. Furthermore, some others have many "Nan" values like cloudiness amount, sunbath intensity, and wind direction. The extra features were omitted in the first place.
The weather data were gathered at hourly intervals, but the target values are in 15 minute intervals.
All data are gathered together and normalized as below.
pressure
temp.
min_temp
max_temp
humidity
speed
month
season
day/week
avg
min
max
0.004653
0.0008458
0.004653
0.004653
0.0008458
0.004653
0.004653
0.0008458
0.004653
0.004653
0.004653
0.004653
0.004653
0.0008458
0.004653
0.004653
0.0008458
0.004653
0.004653
0.0008458
0.004653
0.004653
0.004653
0.004653
0.004653
0.0008458
0.004653
0.004653
0.0008458
0.004653
0.004653
0.0008458
0.004653
0.004653
0.004653
0.004653
0.004653
0.0008458
0.004653
0.004653
0.0008458
0.004653
0.004653
0.0008458
0.004653
0.004653
0.004653
0.004653
0.004653
0.0008458
0.004653
0.004653
0.0008458
0.004653
0.004653
0.0008458
0.004653
0.004653
0.004653
0.004653
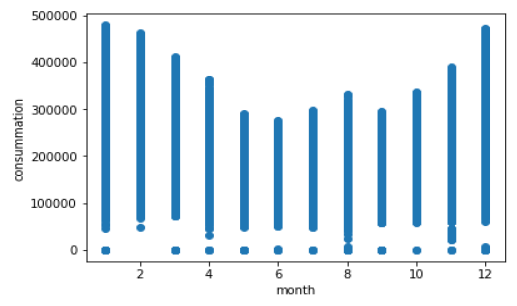
The most significant independent variable is the weather. Weather conditions influence domestic and agriculture subscribers more than industrial ones. Because of weather variables, having different load curves for each season is a possibility.
The weather factors are listed below:
The total consumption in summer and winter is much higher than in spring and fall. Most of the people use air conditioners in these two seasons.
Humans behaviour is unpredictable that no science is able to anticipate whole human behaviour and it even twists more when the case is related to a population. Every engineering project has its undesired issues.
The part of the case study is about using the Nuorol Networks and other models for Load Forecasting. This part shows the procedure of forecasting. And finally, the last part is about results.
This demo has three case studies for forecasting. The first one uses just calendar variables for forecasting the load, and the second was only used in weather variables. At first, some of the features were chosen with more impact on the load curve in both of the cases.
The third case uses all of the variables to gather. The accuracy of the model is calculated in each case and compared with others to find the best solution.
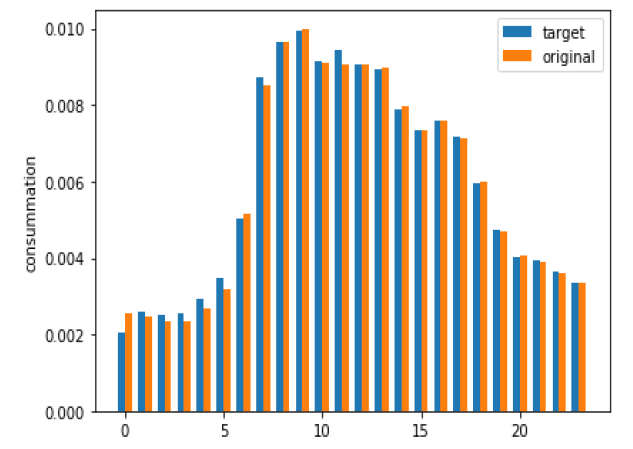
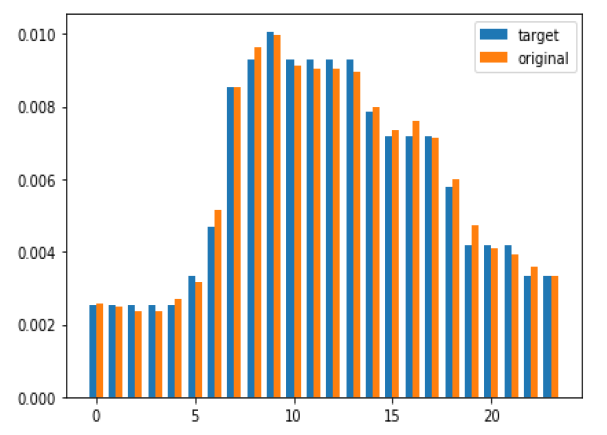
The results of forecasting for 24 hours are in table below. This figure also has the original values and error amount in percent.
Number of features
MAE
MSE
RSQ
Calender features
0.0008458
1.13e-06
0.62579
Weather features
0.0004181
2.55e-07
0.91549
12 features
0.0003479
1.95e-07
0.98530
All data are gathered together and normalized as below.
All data are gathered together and normalized as below.
In the table below RSG values shows the accuracy of four different methods and MSE shwos forecasting errors for different methods
Four models based on the linear, decision, KNN and ANN methods of regression analysis are developed, and the load forecast results obtained from these models are compared using the mean absolute percentage error (MAPE) and root mean square error (RMSE) performance metrics. It is observed that, among these three models, the linear model has the best error margin: 0.0000655 and 8.19e-09 for MAPE and RMSE, respectively.
Model
MAPE
RMSE
RSG
Decision Tree
0.000224
7.64e-08
0.97476
KNN
0.000418
2.55e-07
0.91549
Linear Regression
0.0000655
8.19e-09
0.977295
ANN
0.0003469
1.95e-07
0.985306
We are currently working on a novel, realtime decision-making services to provide AI-based optimization techniques for energy efficient solutions. Contact us for a customized solution.

Anaplatform Data Consultancy is a premium consulting company tailored for businesses and corporations. anaplatform Data Consultancy is ideal for businesses of any type such as corporations, educational institutions, security firms and enterprise-level organizations.


