Style Sampler
Layout Style
Patterns for Boxed Mode


Backgrounds for Boxed Mode
Search News Posts
General Inquiries 1-888-555-5555
•
Support 1-888-555-5555

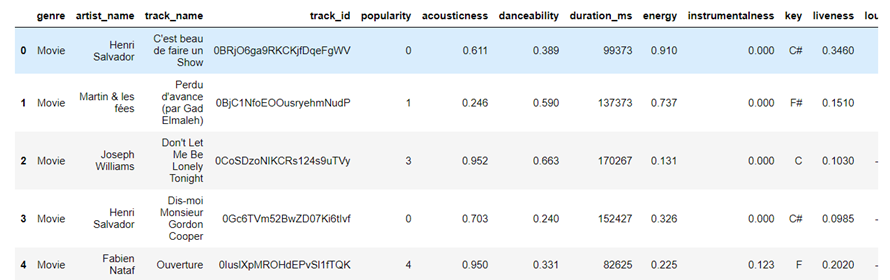
Spotify Analysis
Spotify is the world’s largest audio streaming service and lets you share songs, view lyrics and so much more.In this case study we will be using analysis with Spotify data. We will be analyzing data, visualizing and drawing insights.
We will be using analytics to know which year highest TV Shows and Movies were released.
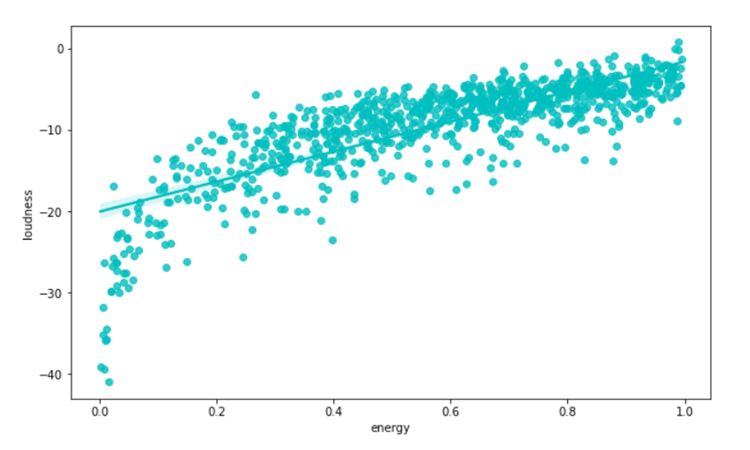
Let’s create a regression plot that shows the relationship between loudness and energy. I’ll plot this regression line below.
The result is plotted. As the volume gets louder, the energy values go up. The data points provided are all in one direction, which means that as the volume goes up, so does the energy level. The volume of the song increases in correlation with the pitch, so that if a song is louder, it simultaneously sounds fast. Similarly, if a song’s pitch is higher, its volume also increases correspondingly; if the pitch decreases and gets lower-pitched, then its volume also lowers to match this.
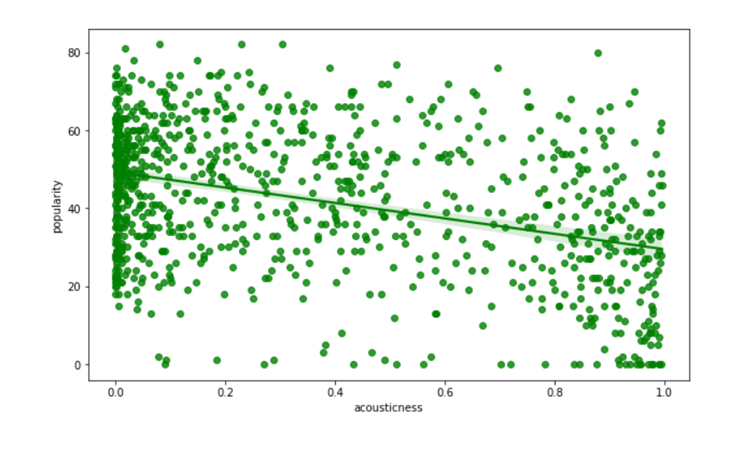
Now we can also plot another regression plot between popularity and energy.
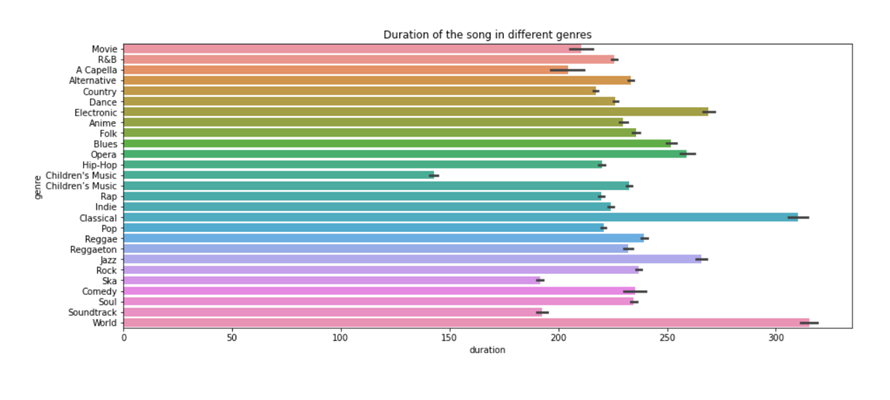
Now we will show a bar plot which shows duration. The duration of songs varies quite a lot by genre.
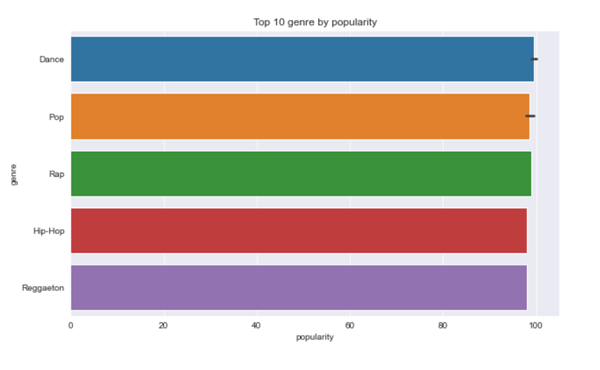
And here is the bar plot for top five genres by Popularity and pot a barplot for the same.
The result is that the ARPU is $ 27.32 and the Net Revenue per user is $25.32.
Here are the Findings
Anaplatform Data Consultancy is a premium consulting company tailored for businesses and corporations. anaplatform Data Consultancy is ideal for businesses of any type such as corporations, educational institutions, security firms and enterprise-level organizations.


